Lab: Toolchain Setup with Spike, QEMU, and Cross-Toolchains
September 13, 202631 min readintermediate
The assembler project in Chapter 23 produced raw machine-code bytes from hand-written assembly. The next step is to run those bytes on something that behaves like a RISC-V processor. This lab sets up two…
The assembler project in Chapter 23 produced raw machine-code bytes from hand-written assembly. The next step is to run those bytes on something that behaves like a RISC-V processor. This lab sets up two RISC-V execution environments (Spike and QEMU), the GNU and LLVM cross-compilation toolchains, and walks the reader through compiling a C program, examining its assembly output, running it on both simulators, and single-stepping through individual instructions.
By the end of this lab, the reader will have a complete, local, zero-cost RISC-V development environment that works on macOS, Linux, or Windows. This environment is used throughout Parts III through V whenever the text asks the reader to “compile and run” a RISC-V program or to inspect generated assembly.
01.Setup and Installation
Four components are needed: the RISC-V GNU cross-toolchain (riscv64-unknown-elf-gcc and its companion tools), the Spike ISA simulator, the RISC-V proxy kernel (pk), and QEMU. An optional fifth component is LLVM/Clang for cross- compilation.
macOS (Homebrew)
macOS setup via Homebrew
| # RISC-V GNU toolchain (bare-metal) | |
| brew tap riscv-software-src/riscv | |
| brew install riscv-tools | |
| # The tap provides: | |
| # riscv64-unknown-elf-gcc | |
| # riscv64-unknown-elf-as | |
| # riscv64-unknown-elf-objdump | |
| # spike (ISA simulator) | |
| # pk (proxy kernel) | |
| # QEMU with RISC-V support | |
| brew install qemu | |
| # Optional: LLVM (includes Clang with RISC-V target) | |
| brew install llvm |
Verify macOS installations
Linux (Arch as canonical)
Arch Linux setup
| # GNU cross-toolchain (bare-metal) | |
| sudo pacman -S riscv64-elf-gcc riscv64-elf-binutils \ | |
| riscv64-elf-newlib riscv64-elf-gdb | |
| # Spike (from AUR) | |
| yay -S spike | |
| # Proxy kernel (from AUR) | |
| yay -S riscv-pk | |
| # QEMU | |
| sudo pacman -S qemu-system-riscv qemu-user | |
| # Optional: LLVM/Clang | |
| sudo pacman -S clang lld |
For Debian/Ubuntu:
Debian/Ubuntu alternative
| sudo apt install gcc-riscv64-unknown-elf \ | |
| binutils-riscv64-unknown-elf \ | |
| qemu-system-misc qemu-user | |
| # Spike and pk: build from source | |
| # (see github.com/riscv-software-src/riscv-isa-sim | |
| # and github.com/riscv-software-src/riscv-pk) |
For Fedora:
Fedora alternative
| sudo dnf install gcc-riscv64-linux-gnu \ | |
| binutils-riscv64-linux-gnu qemu-system-riscv | |
| # These packages target RISC-V Linux, not bare metal. The | |
| # bare-metal newlib toolchain used by the lab exercises has | |
| # to be built from source, as do Spike and pk. |
Windows (ArchWSL)
The RISC-V toolchain, Spike, and QEMU are Linux-native tools. On Windows, the recommended approach is to install them inside WSL2 with ArchWSL.
Windows setup via ArchWSL
| # Inside the ArchWSL terminal: | |
| sudo pacman -S riscv64-elf-gcc riscv64-elf-binutils \ | |
| riscv64-elf-newlib riscv64-elf-gdb | |
| yay -S spike riscv-pk | |
| sudo pacman -S qemu-system-riscv qemu-user |
Native Windows builds of QEMU exist (installable via winget install SoftwareFreedomConservancy.QEMU), but Spike and the GNU toolchain do not have maintained native Windows installers. The WSL2 path provides the most consistent experience.
LLVM/Clang is an exception: it runs natively on Windows and supports RISC-V as a cross-compilation target out of the box. Install via winget install LLVM.LLVM or download from the LLVM releases page.
Containers, when the native paths fail
Every path above installs the toolchain onto the machine, which is what you want. The tools are then on the path, the debugger can see the source tree without a mount, and nothing stands between an editor and a compiler. Reach for a container only when the native path is genuinely blocked: a distribution with no packages and no patience for a source build, a locked-down corporate machine, or a need to reproduce someone else’s exact toolchain version while chasing a bug that only appears there.
A container gives one thing the other paths cannot, which is an exactly pinned environment. The RISC-V toolchain moves, and an encoding accepted by one binutils release can be rejected by the next. When a lab result has to be reproducible across three machines and two operating systems, pinning the image tag is the only mechanism that actually pins it.
A pinned toolchain container
| # Pull a published RISC-V toolchain image and pin the tag. | |
| # Never use :latest for anything you intend to reproduce. | |
| docker pull riscv64/riscv-gnu-toolchain:2024.09.03 | |
| # Run it with the current directory mounted as /work, as the | |
| # calling user, so files it writes are not owned by root. | |
| docker run --rm -it \ | |
| -v "$PWD":/work -w /work \ | |
| -u "$(id -u):$(id -g)" \ | |
| riscv64/riscv-gnu-toolchain:2024.09.03 \ | |
| riscv64-unknown-elf-gcc -march=rv64gc -mabi=lp64d \ | |
| -O2 -S hello.c -o hello.s |
Podman runs the same commands with the same flags and needs no daemon and no root, which is often what makes it the acceptable option on a machine where Docker is not. Substitute podman for docker throughout.
The exercises that follow are written against a native toolchain and every command in them works unchanged inside a container, with the container invocation wrapped around it. Defining a shell function for that wrapper once is less error-prone than typing the mount flags on every command.
02.Compiling C to RISC-V Assembly
The first exercise compiles a simple C program to RISC-V assembly and examines the output. This connects the high-level C source to the instruction encodings studied in Part II.
The source program
A simple C program for cross-compilation
/* sum.c -- sum the integers 1 through N */
#include <stdio.h>

int sum(int n) {
    int total = 0;
    for (int i = 1; i <= n; i++) {
        total += i;
    }
    return total;
}

int main(void) {
    int result = sum(100);
    printf("Sum = %d\n", result);
    return 0;
}
Compiling to assembly
Compiling to RISC-V assembly with GCC
| # Generate assembly output (-S flag) | |
| riscv64-unknown-elf-gcc -march=rv32im -mabi=ilp32 \ | |
| -O1 -S sum.c -o sum.s | |
| # Inspect the generated assembly | |
| cat sum.s |
The -march=rv32im flag targets the RV32IM instruction set (32-bit base plus multiply/divide). The -mabi=ilp32 flag selects the 32-bit integer ABI. The -O1 optimization level produces readable assembly without excessive register spilling.
Reading the generated assembly
Open sum.s in a text editor and find the sum function. At -O1, GCC typically produces a tight loop using add, addi, bge (or blt), and a return sequence. Identify:
-
The function prologue (saving
raands0–s11to the stack, if any). -
The loop body (the
addthat accumulates the sum and the branch that controls the loop). -
The function epilogue (restoring saved registers and returning via
ret).
Compare the generated code with the calling conventions described in Chapter 19. Which registers does GCC use for the function argument (n), the return value, and the loop counter?
Using LLVM/Clang
Compiling to RISC-V assembly with Clang
| clang --target=riscv32 -march=rv32im -mabi=ilp32 \ | |
| -O1 -S sum.c -o sum_clang.s |
Compare sum.s (GCC output) with sum_clang.s (Clang output). The two compilers often make different register allocation and instruction scheduling decisions. Both outputs are correct but may differ in instruction count and register usage.
03.Assembling and Linking
Assembling and linking
| # Assemble to an object file | |
| riscv64-unknown-elf-gcc -march=rv32im -mabi=ilp32 \ | |
| -c sum.c -o sum.o | |
| # Link to an ELF executable (bare-metal, using pk) | |
| riscv64-unknown-elf-gcc -march=rv32im -mabi=ilp32 \ | |
| sum.o -o sum.elf | |
| # Disassemble the executable | |
| riscv64-unknown-elf-objdump -d sum.elf | less |
The objdump -d output shows every instruction in the executable, including the C runtime startup code (_start) and the library functions linked in. The sum and main functions appear as labeled sections. Each line shows the address, the hexadecimal encoding, and the disassembled mnemonic.
04.Running on Spike
Spike is the RISC-V ISA functional simulator. It executes RISC-V instructions one at a time, faithfully implementing the ISA specification. Spike is not cycle-accurate: it does not model pipeline stages, caches, or branch prediction. Its purpose is correctness verification.
Running a program
Running on Spike with the proxy kernel
| # sum.elf is an RV32IM binary, but Spike defaults to RV64, | |
| # so the ISA string has to be given explicitly and pk has to | |
| # be the RV32 build of the proxy kernel. | |
| spike --isa=rv32im pk sum.elf |
The proxy kernel (pk) provides a minimal runtime environment that handles printf, malloc, and program exit by forwarding system calls to the host operating system. The output should print Sum = 5050.
None of the setup routes above produces that RV32 build. The Homebrew tap and the Arch riscv-pk package both configure the proxy kernel for RV64, and so does the default build in the riscv-pk README, which the Debian and Fedora routes follow. Spike refuses to load a 64-bit pk onto the 32-bit core that --isa=rv32im asks for. The listing below builds the 32-bit version as that README describes. It installs pk under riscv32-unknown-elf/bin in the chosen prefix, and every Spike command in this lab that names pk should name that file instead.
Building the RV32 proxy kernel
| git clone https://github.com/riscv-software-src/riscv-pk.git | |
| cd riscv-pk && mkdir build && cd build | |
| # On Arch the toolchain prefix is riscv64-elf. Pass | |
| # --host=riscv64-elf there, and pk lands in riscv32-elf/bin. | |
| ../configure --prefix=$HOME/riscv --host=riscv64-unknown-elf \ | |
| --with-arch=rv32i_zicsr_zifencei | |
| make && make install | |
| spike --isa=rv32im $HOME/riscv/riscv32-unknown-elf/bin/pk sum.elf |
Interactive debugging
Spike supports an interactive debug mode that is invaluable for understanding instruction-level behavior.
Spike interactive debug mode
| spike -d --isa=rv32im pk sum.elf |
At the : prompt, the following commands are available:
Table 1. Spike debug commands
| Command | Action |
|---|---|
run N | Execute N instructions |
reg 0 | Print all integer registers |
reg 0 a0 | Print register a0 |
pc 0 | Print the program counter |
mem 0x80000000 | Print memory at address |
until pc 0 0x80000100 | Run until PC reaches address |
quit | Exit the debugger |
Walkthrough: single-stepping through the sum function. Start Spike in debug mode. Use until pc 0 <addr> to run to the sum function (find the address from the objdump output). Then step one instruction at a time with run 1 and watch the registers change.
After each run 1, print the PC (pc 0) and the registers involved in the current instruction. Trace the loop counter in a0 (or whichever register GCC chose) and the accumulator. Confirm that the final value in the return register is 5050.
Spike and QEMU are not the same tool
The labs use two simulators and it is easy to treat them as interchangeable, since both run the same ELF file and print the same output. They answer different questions, and reaching for the wrong one wastes an afternoon. Figure 1 shows what each one models.
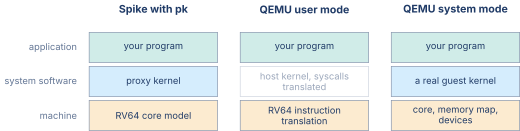
The division tells you which to reach for. A question about encoding or about the exact architectural effect of an instruction goes to Spike, because Spike is written as the specification’s executable form and its instruction semantics are the reference that other implementations are checked against. A question about whether a program produces the right answer goes to QEMU in user mode, which is faster and needs no proxy kernel. And anything involving privilege levels, traps taken to a real handler, page tables or device registers needs system mode, because the other two do not model those at all.
None of the three models time. All of them report instruction counts and none of them report cycles, so a program that runs in a tenth of the simulated instructions of another is doing less work and is not necessarily faster on hardware. Timing needs a cycle-accurate model, which is a different class of tool and a later chapter.
05.Running on QEMU
QEMU provides two modes for RISC-V execution.
User-mode emulation
User-mode QEMU translates RISC-V Linux system calls to host system calls, allowing a RISC-V Linux binary to run directly on the host. This requires a RISC-V Linux executable (compiled with riscv64-unknown-linux-gnu-gcc rather than the bare-metal riscv64-unknown-elf-gcc). User-mode QEMU also needs a Linux host, because QEMU builds this emulator only there. The Homebrew package on macOS therefore installs qemu-system-riscv32 and qemu-system-riscv64 but no qemu-riscv64. On macOS, run sum.elf on Spike with the RV32 pk as earlier in this lab. Spike prints the same result.
QEMU user-mode emulation
| # Compile for RISC-V Linux (if the Linux toolchain | |
| # is installed) | |
| riscv64-unknown-linux-gnu-gcc -march=rv64gc \ | |
| -static sum.c -o sum_linux | |
| # Run on QEMU user-mode | |
| qemu-riscv64 sum_linux |
The -static flag produces a statically linked binary, avoiding the need for RISC-V shared libraries on the host. The output is the same: Sum = 5050.
System-mode emulation
System-mode QEMU emulates an entire RISC-V machine: CPU, memory, UART, and other devices. It can boot a full Linux kernel or run bare-metal firmware.
QEMU system-mode (bare-metal, no BIOS)
| # sum.elf is a 32-bit binary, so the RV32 machine emulator | |
| # is the right one. An rv64gc build needs qemu-system-riscv64. | |
| qemu-system-riscv32 -machine virt -nographic \ | |
| -bios none -kernel sum.elf |
System-mode emulation is more involved than user-mode because the binary must include its own startup code (or be loaded by pk or OpenSBI). For this lab, user-mode emulation is sufficient.
06.Examining the Binary with objdump
The objdump utility is the bridge between the binary world and the human-readable assembly world. This exercise practices several objdump invocations.
Useful objdump invocations
| # Full disassembly | |
| riscv64-unknown-elf-objdump -d sum.elf | |
| # Disassemble a single function | |
| riscv64-unknown-elf-objdump -d \ | |
| --disassemble=sum sum.elf | |
| # Show section headers (text, data, bss sizes) | |
| riscv64-unknown-elf-objdump -h sum.elf | |
| # Show the symbol table | |
| riscv64-unknown-elf-objdump -t sum.elf | |
| # Intermix source lines with assembly | |
| # (requires -g debug info during compilation) | |
| riscv64-unknown-elf-objdump -dS sum.elf |
Exercise: decode by hand. Pick any three instructions from the objdump output. For each, write down the hexadecimal encoding, identify the format (R, I, S, B, U, J), and manually decode the fields. Confirm that your decoding matches the disassembled mnemonic. This exercise connects the binary encoding work from Chapter 23 to the toolchain output.
07.Compiler Optimization Effects
Compile sum.c at four optimization levels and compare the generated assembly.
Compiling at different optimization levels
| for opt in O0 O1 O2 O3; do | |
| riscv64-unknown-elf-gcc -march=rv32im \ | |
| -mabi=ilp32 -$opt -S sum.c -o sum_$opt.s | |
| done |
At -O0, the compiler generates straightforward code with every variable stored on the stack. At -O1, most variables live in registers. At -O2 and -O3, the compiler may unroll the loop, use strength reduction (replacing multiplication by repeated addition), or even compute the sum at compile time using the closed-form formula .
Count the number of instructions in the sum function at each level. Record your results in a table. Pay particular attention to -O2 and -O3: if the compiler recognizes the pattern , it may replace the entire loop with a single multiply and shift, reducing the function body to three or four instructions.
The stack frame size is also instructive. At -O0, every local variable (total, i, and the function argument n) is stored on the stack, requiring a sp-adjustment prologue and epilogue. At -O1 and above, the variables live in registers and the stack frame may shrink to zero if the function is a leaf (no calls to other functions).
Table 2. Instruction count versus optimization level (fill in)
| Metric | -O0 | -O1 | -O2 | -O3 |
|---|---|---|---|---|
Instructions in sum | ||||
| Stack frame size (bytes) |
08.GDB Remote Debugging
Source-level debugging with GDB is the standard workflow for finding bugs in cross-compiled programs. QEMU can act as a GDB server, accepting connections directly from the RISC-V GDB client. Spike reaches GDB by a longer route, described below.
Starting the GDB server
Starting QEMU with a GDB server
| # Start QEMU user-mode with GDB server on port 1234 | |
| qemu-riscv64 -g 1234 sum_linux & | |
| # In a separate terminal, connect GDB | |
| riscv64-unknown-elf-gdb sum_linux | |
| (gdb) target remote :1234 | |
| (gdb) break sum | |
| (gdb) continue |
When the breakpoint hits, GDB shows the current instruction. The reader can inspect registers (info registers), examine memory (x/4x $sp), single-step (stepi), and set watchpoints on memory addresses. This route needs user-mode QEMU and therefore a Linux host. On macOS, use Spike’s interactive debug mode from earlier in this lab, which offers the same register and memory inspection and single-stepping.
Spike GDB connection
Spike does not implement the GDB remote protocol itself. What it exposes is a remote-bitbang JTAG port, which OpenOCD attaches to and then presents to GDB as a conventional GDB server. The connection is therefore a three-program chain of Spike, OpenOCD, and GDB rather than the direct target remote attachment that QEMU supports.
Spike with a remote-bitbang JTAG port
| # Start Spike with its remote-bitbang JTAG port on 9824 | |
| spike -H --rbb-port=9824 --isa=rv32im pk sum.elf & | |
| # OpenOCD attaches to port 9824 and publishes a GDB server | |
| # of its own, which GDB then connects to. For simple | |
| # inspection, spike's built-in -d debug mode is easier. |
For most debugging tasks in this lab, Spike’s built-in interactive debugger (the -d flag from the interactive debugging section earlier in this lab) is simpler than the GDB remote protocol.
09.Compressed Instructions in Practice
Compile with the C extension enabled and compare the binary size.
Comparing RV32IM versus RV32IMC
| # Without C extension | |
| riscv64-unknown-elf-gcc -march=rv32im -mabi=ilp32 \ | |
| -O2 sum.c -o sum_no_c.elf | |
| # With C extension | |
| riscv64-unknown-elf-gcc -march=rv32imc -mabi=ilp32 \ | |
| -O2 sum.c -o sum_c.elf | |
| # Compare sizes | |
| riscv64-unknown-elf-size sum_no_c.elf sum_c.elf |
Disassemble both executables and count the 16-bit instructions (they appear with only 4 hex digits in the encoding column of objdump output, compared to 8 hex digits for 32-bit instructions). What fraction of instructions are compressed?
10.Examining the Symbol Table and Sections
Every ELF executable contains metadata beyond the machine code. This exercise explores the symbol table and section layout.
Examining symbols and sections
| # Section headers: text, data, bss, rodata, etc. | |
| riscv64-unknown-elf-readelf -S sum.elf | |
| # Symbol table: functions, global variables, sizes | |
| riscv64-unknown-elf-readelf -s sum.elf | |
| # Program headers: load segments, entry point | |
| riscv64-unknown-elf-readelf -l sum.elf | |
| # Hex dump of the .rodata section (string literals) | |
| riscv64-unknown-elf-readelf -x .rodata sum.elf |
The readelf output reveals several things that objdump does not show clearly. The section headers table lists every section with its type, address, offset in the file, and size. The .text section contains the machine code. The .rodata section contains read-only data (string literals like "Sum = %d\n"). The .bss section reserves space for uninitialized global variables without occupying space in the file.
The symbol table lists every function and global variable with its address, size, binding (local or global), and section. The sum function should appear as a global symbol in the .text section. Its size field tells how many bytes the function occupies.
Two views of the same ELF file
readelf prints two tables that describe the same bytes and disagree about how they are grouped, and a first reading of its output is usually spent trying to reconcile them. They are not meant to be reconciled. An ELF file carries a section header table for the linker and a program header table for the loader, and the two audiences want different groupings. Figure 2 draws both over one file.
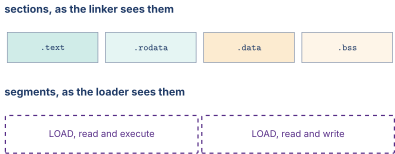
Three consequences of that split are visible in ordinary output. The section count and the segment count never match, and there is no reason they should. A section can appear in no segment at all, which is what happens to the symbol table and the debug information, and that is why stripping a binary removes bytes without changing what runs. And .bss occupies no space in the file while occupying space in memory, because its contents are known to be zero and the loader can produce zero without reading it.
The permission grouping is also where a security property lives. A segment marked writable and executable at once would allow a program to write instructions and then run them, so linkers refuse to produce one by default, and the two-segment layout in the figure is what that refusal looks like on disk.
11.Understanding the Toolchain Pipeline
A cross-compilation toolchain is a pipeline with four stages, and understanding how the stages connect prevents a large class of common errors.
Stage 1: Preprocessor. The C preprocessor (cpp) expands #include directives, #define macros, and conditional compilation blocks. The output is a single preprocessed .i file with no directives remaining. Run riscv64-unknown-elf-gcc -E sum.c -o sum.i to see the preprocessed output.
Stage 2: Compiler. The compiler (cc1 inside GCC, or clang in LLVM) translates the preprocessed C source into RISC-V assembly. The -S flag stops after this stage. The output is a human-readable .s file.
Stage 3: Assembler. The assembler (riscv64-unknown-elf-as, or the integrated assembler in LLVM) translates the assembly into an ELF object file (.o). This is the stage that the project in Chapter 23 reimplemented from scratch. The -c flag tells gcc to stop after assembly.
Stage 4: Linker. The linker (riscv64-unknown-elf-ld, invoked automatically by gcc) combines one or more object files with the C runtime startup code and libraries (newlib for bare-metal, glibc for Linux) to produce a final ELF executable.
Running each stage separately
| # Stage 1: Preprocess | |
| riscv64-unknown-elf-gcc -E sum.c -o sum.i | |
| # Stage 2: Compile to assembly | |
| riscv64-unknown-elf-gcc -march=rv32im -mabi=ilp32 \ | |
| -O2 -S sum.i -o sum.s | |
| # Stage 3: Assemble to object file | |
| riscv64-unknown-elf-as -march=rv32im sum.s -o sum.o | |
| # Stage 4: Link | |
| riscv64-unknown-elf-gcc -march=rv32im -mabi=ilp32 \ | |
| sum.o -o sum.elf |
Running the stages separately is useful for debugging. If the generated assembly looks wrong, the bug is in Stage 2 (compiler flags or source code). If the object file has wrong encodings, the bug is in Stage 3. If the executable crashes at startup before reaching main, the bug is in Stage 4 (a missing library, a wrong linker script, or an ABI mismatch).
The pipeline, and where to cut into it
The single command gcc hello.c -o hello runs four separate programs, and almost every confusing toolchain error is a message from one of them that reads as though it came from another. Knowing which program produced a message is most of diagnosing it. Figure 3 names the four, the file each one consumes and produces, and the flag that stops the pipeline there.

The diagnostic value of this is that each stage fails in its own vocabulary. An undeclared identifier is a compiler message and appears before any assembly exists. An unknown mnemonic or an immediate out of range is an assembler message about a line of .s that the compiler generated or you wrote. And an undefined reference is a linker message, produced after every translation unit compiled successfully, which is why it names a symbol rather than a line number.
The most common confusion in the whole list is between the last two. A missing function body compiles and assembles without complaint, because a call to an undefined symbol is a perfectly well-formed instruction with a relocation attached. Only the linker, which is the first program to see all the object files at once, is in a position to notice that nothing defines it.
12.Common Pitfalls
Architecture and ABI mismatch. Compiling with -march=rv32im but linking with a 64-bit library (or vice versa) produces a linker error about incompatible ELF classes. The -march and -mabi flags must be consistent across all stages. For 32-bit: -march=rv32im -mabi=ilp32. For 64-bit: -march=rv64gc -mabi=lp64d.
Missing pk for Spike. Running spike sum.elf without pk in front does not fail at load time. Spike reads the ELF program headers and jumps to the entry point exactly as it does for pk itself, which is also an ELF executable. The failure comes later. With no proxy kernel underneath it, nothing services the newlib system calls that printf, malloc, and program exit issue, so the ecall traps into machine mode with no handler installed and the program aborts or hangs instead of printing. Always run programs that use C library functions under the proxy kernel.
Static versus dynamic linking. QEMU user-mode needs access to the target’s shared libraries if the binary is dynamically linked. The simplest workaround is to compile with -static, which embeds the entire C library into the executable. The binary is larger but runs anywhere without library dependencies.
Floating-point ABI confusion. The ilp32 ABI passes floats in integer registers (soft float). The ilp32f and ilp32d ABIs pass floats in floating-point registers. Mixing ABIs across object files produces silent data corruption (a float value is written to an integer register in one function and read from a float register in the callee). Always use the same -mabi flag for all compilation units.
13.Looking Ahead
This lab chapter completes Part II of the book. The reader now has a full understanding of instruction set architectures (what instructions exist, how they are encoded, how the ISA organizes privilege levels and exceptions, and how vector and SIMD extensions exploit data-level parallelism) and a working cross-compilation and simulation environment for RISC-V.
Part III turns to the hardware that executes these instructions. Chapter 25 develops the single-cycle RISC-V datapath block by block, and Chapter 26 turns the instruction encodings from Part II into the control decoder that steers it. Chapter 28 introduces pipelining, and Chapter 30 tackles the hazards that arise when instructions overlap in the pipeline. Chapter 34 pulls the sequence together into a pipelined RV32IM core written in Chisel. Spike, set up in this lab, becomes the golden reference against which the reader checks the pipelined CPU in Chapters 34 and 35.